


Table of contents
- Introduction
- Understanding Azure Application Insights
- Importance of Data Visualization
- Choosing the Right Visualization Tools
- Utilizing Custom Dashboards
- Creating Interactive Reports
- Visualizing Performance Metrics
- Incorporating User Engagement Metrics
- Identifying and Visualizing Errors
- Monitoring Conversion Funnels
- Optimizing for Mobile
- Collaboration through Shared Visualizations
- Staying Updated with Alerts
- Integrating with Other Azure Services
- Conclusion
In the digital age, data has become a crucial asset for businesses seeking to gain insights and make informed decisions. Azure Application Insights, a comprehensive monitoring and diagnostics service by Microsoft, empowers developers and teams to track the performance and usage of their applications. With the wealth of data generated, effective data visualization is key to extracting meaningful insights. In this article, we'll explore tips for optimizing data visualization in Azure Application Insights.
Introduction
In today's technology-driven world, applications are at the heart of businesses. Azure Application Insights offers a comprehensive solution for monitoring applications, allowing developers to collect and analyze various performance metrics, user behaviors, and other critical data. However, raw data is often overwhelming, and that's where effective data visualization comes into play.
Understanding Azure Application Insights
Azure Application Insights provides developers with a suite of tools to monitor and diagnose the health and performance of their applications. It collects telemetry data from various sources, including web applications, services, and mobile apps. This telemetry data can range from performance metrics to user interactions, helping developers gain insights into how their applications are being used.
Importance of Data Visualization
Data visualization transforms complex data sets into easily digestible visuals. Visual representations of data allow for a quicker and more intuitive understanding of trends, patterns, and anomalies. With Azure Application Insights, turning raw telemetry data into meaningful charts, graphs, and dashboards enhances the ability to make data-driven decisions.
Choosing the Right Visualization Tools
Azure Application Insights offers a range of visualization tools, each suited for different types of data. Choosing the right tool for the job is essential for conveying the intended insights effectively. Whether it's line charts for time-series data or pie charts for percentage breakdowns, selecting the appropriate visualization enhances the clarity of your data.
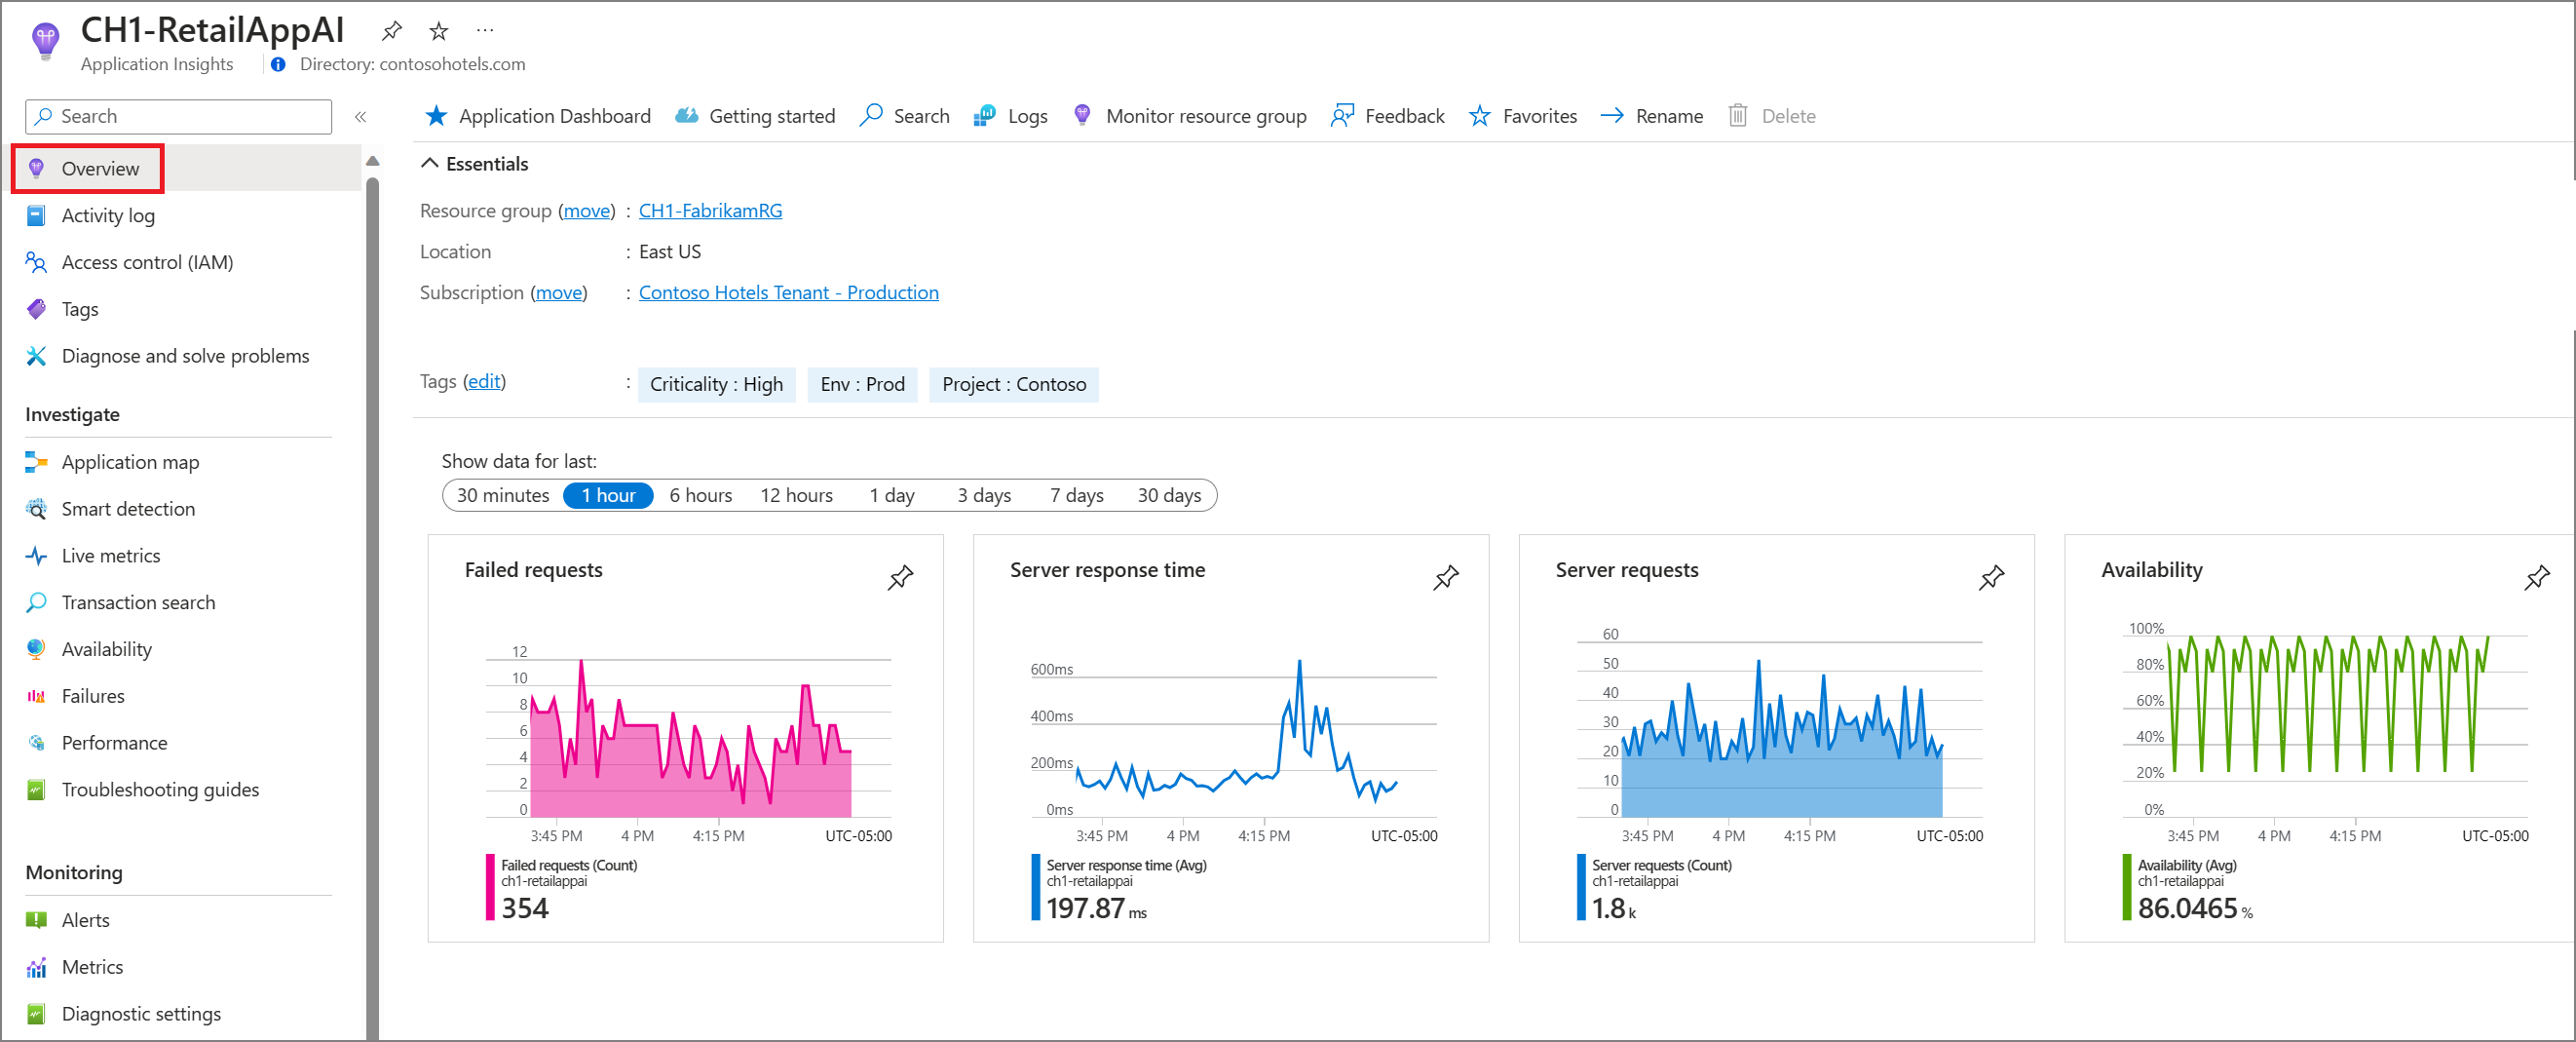
Utilizing Custom Dashboards
Custom dashboards in Azure Application Insights provide a tailored view of your application's performance and usage. By selecting specific metrics and arranging them in a way that makes sense for your team, you can create an at-a-glance overview that highlights the most relevant information.
Creating Interactive Reports
Interactive reports take data visualization a step further. They enable users to explore data on their terms, filtering and drilling down to specific aspects. Azure Application Insights allows you to create interactive reports that empower stakeholders to engage with the data directly, leading to more insightful discussions.
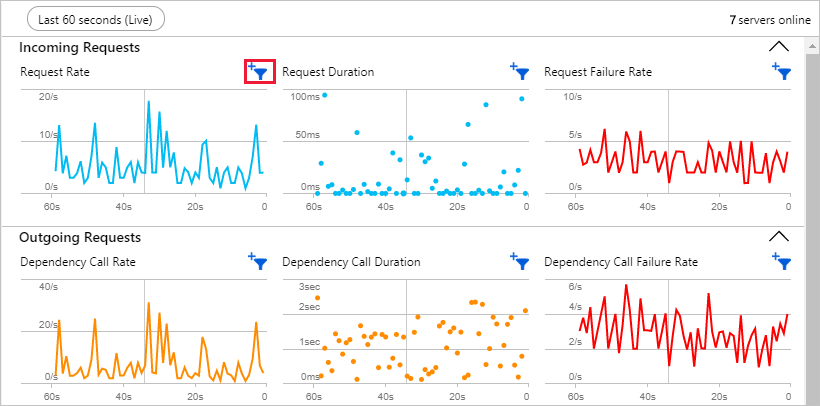
Visualizing Performance Metrics
Monitoring the performance of your application is crucial for providing a smooth user experience. Through Azure Application Insights, you can visualize metrics such as response times, server performance, and request rates. These visuals help you identify performance bottlenecks and take proactive measures.
Incorporating User Engagement Metrics
Understanding how users interact with your application is invaluable. Azure Application Insights captures user engagement metrics like page views, click-through rates, and session durations. Visualizing these metrics can shed light on user behavior patterns and preferences.
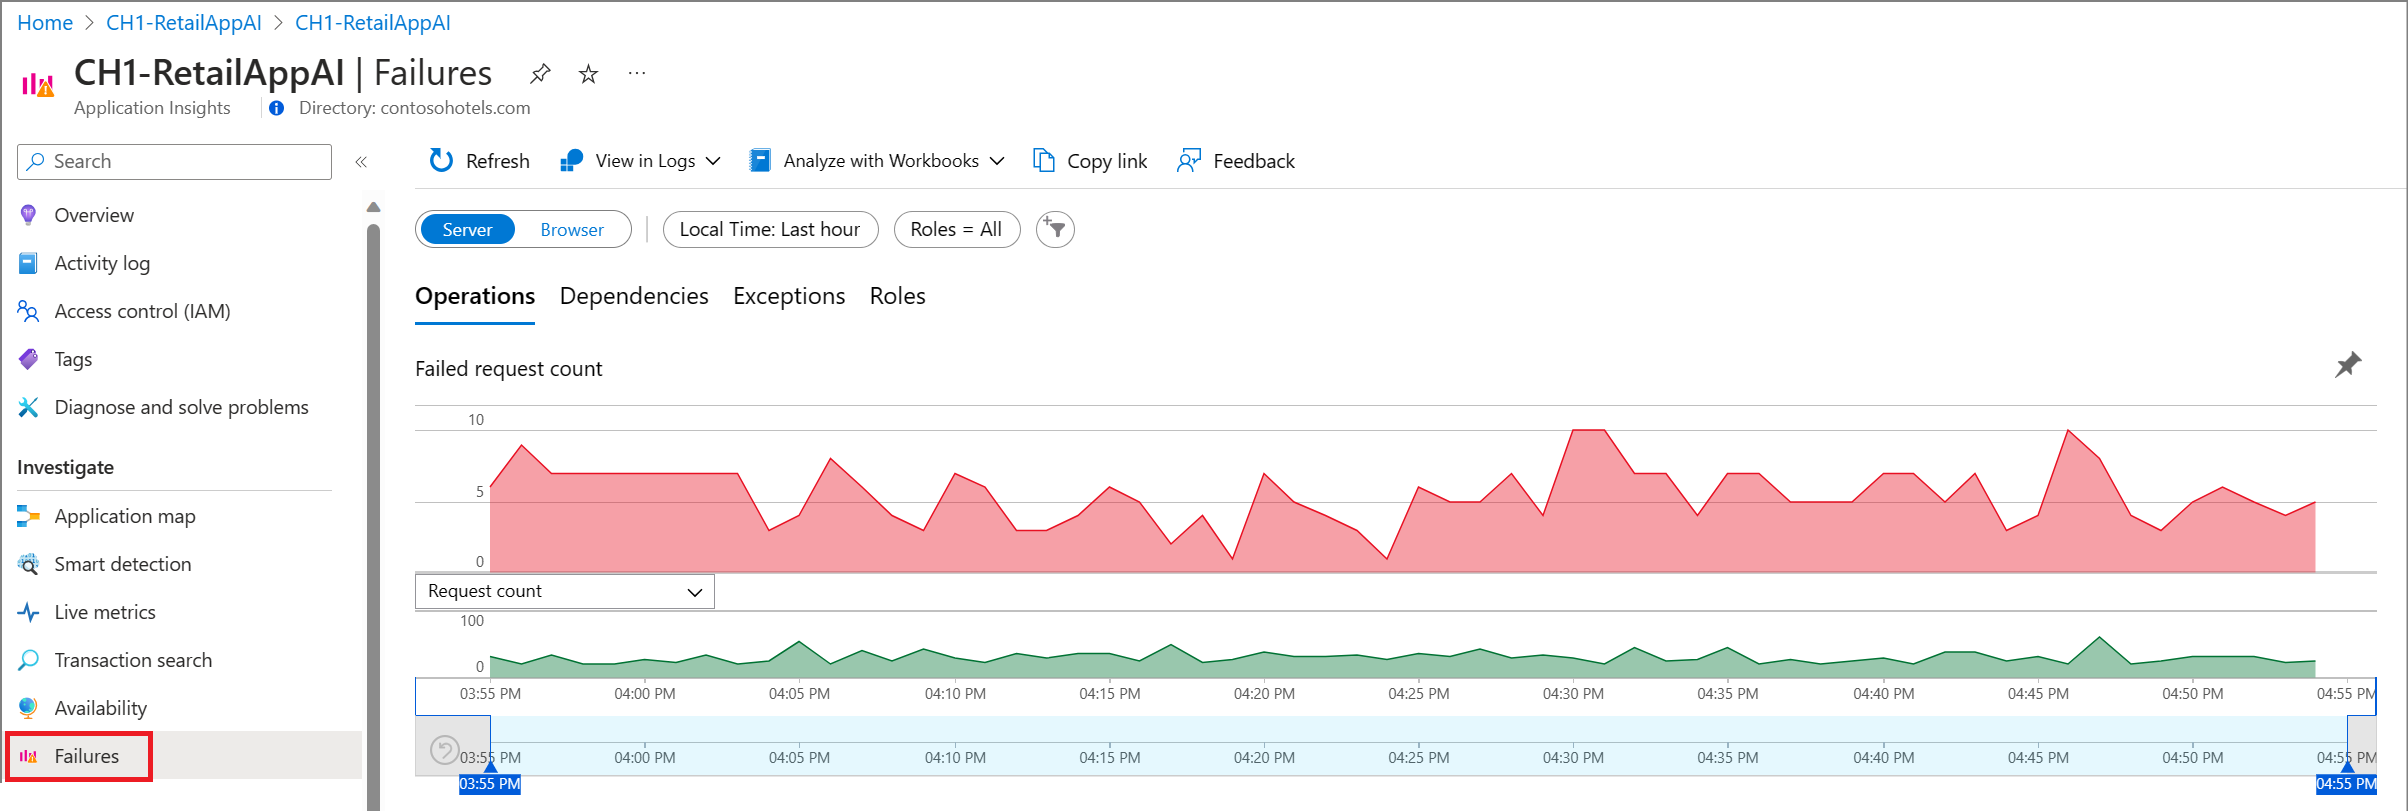
Identifying and Visualizing Errors
No application is immune to errors. Azure Application Insights helps you identify errors and exceptions in your code. By visualizing error data, you can pinpoint the most critical issues and allocate resources effectively to resolve them.
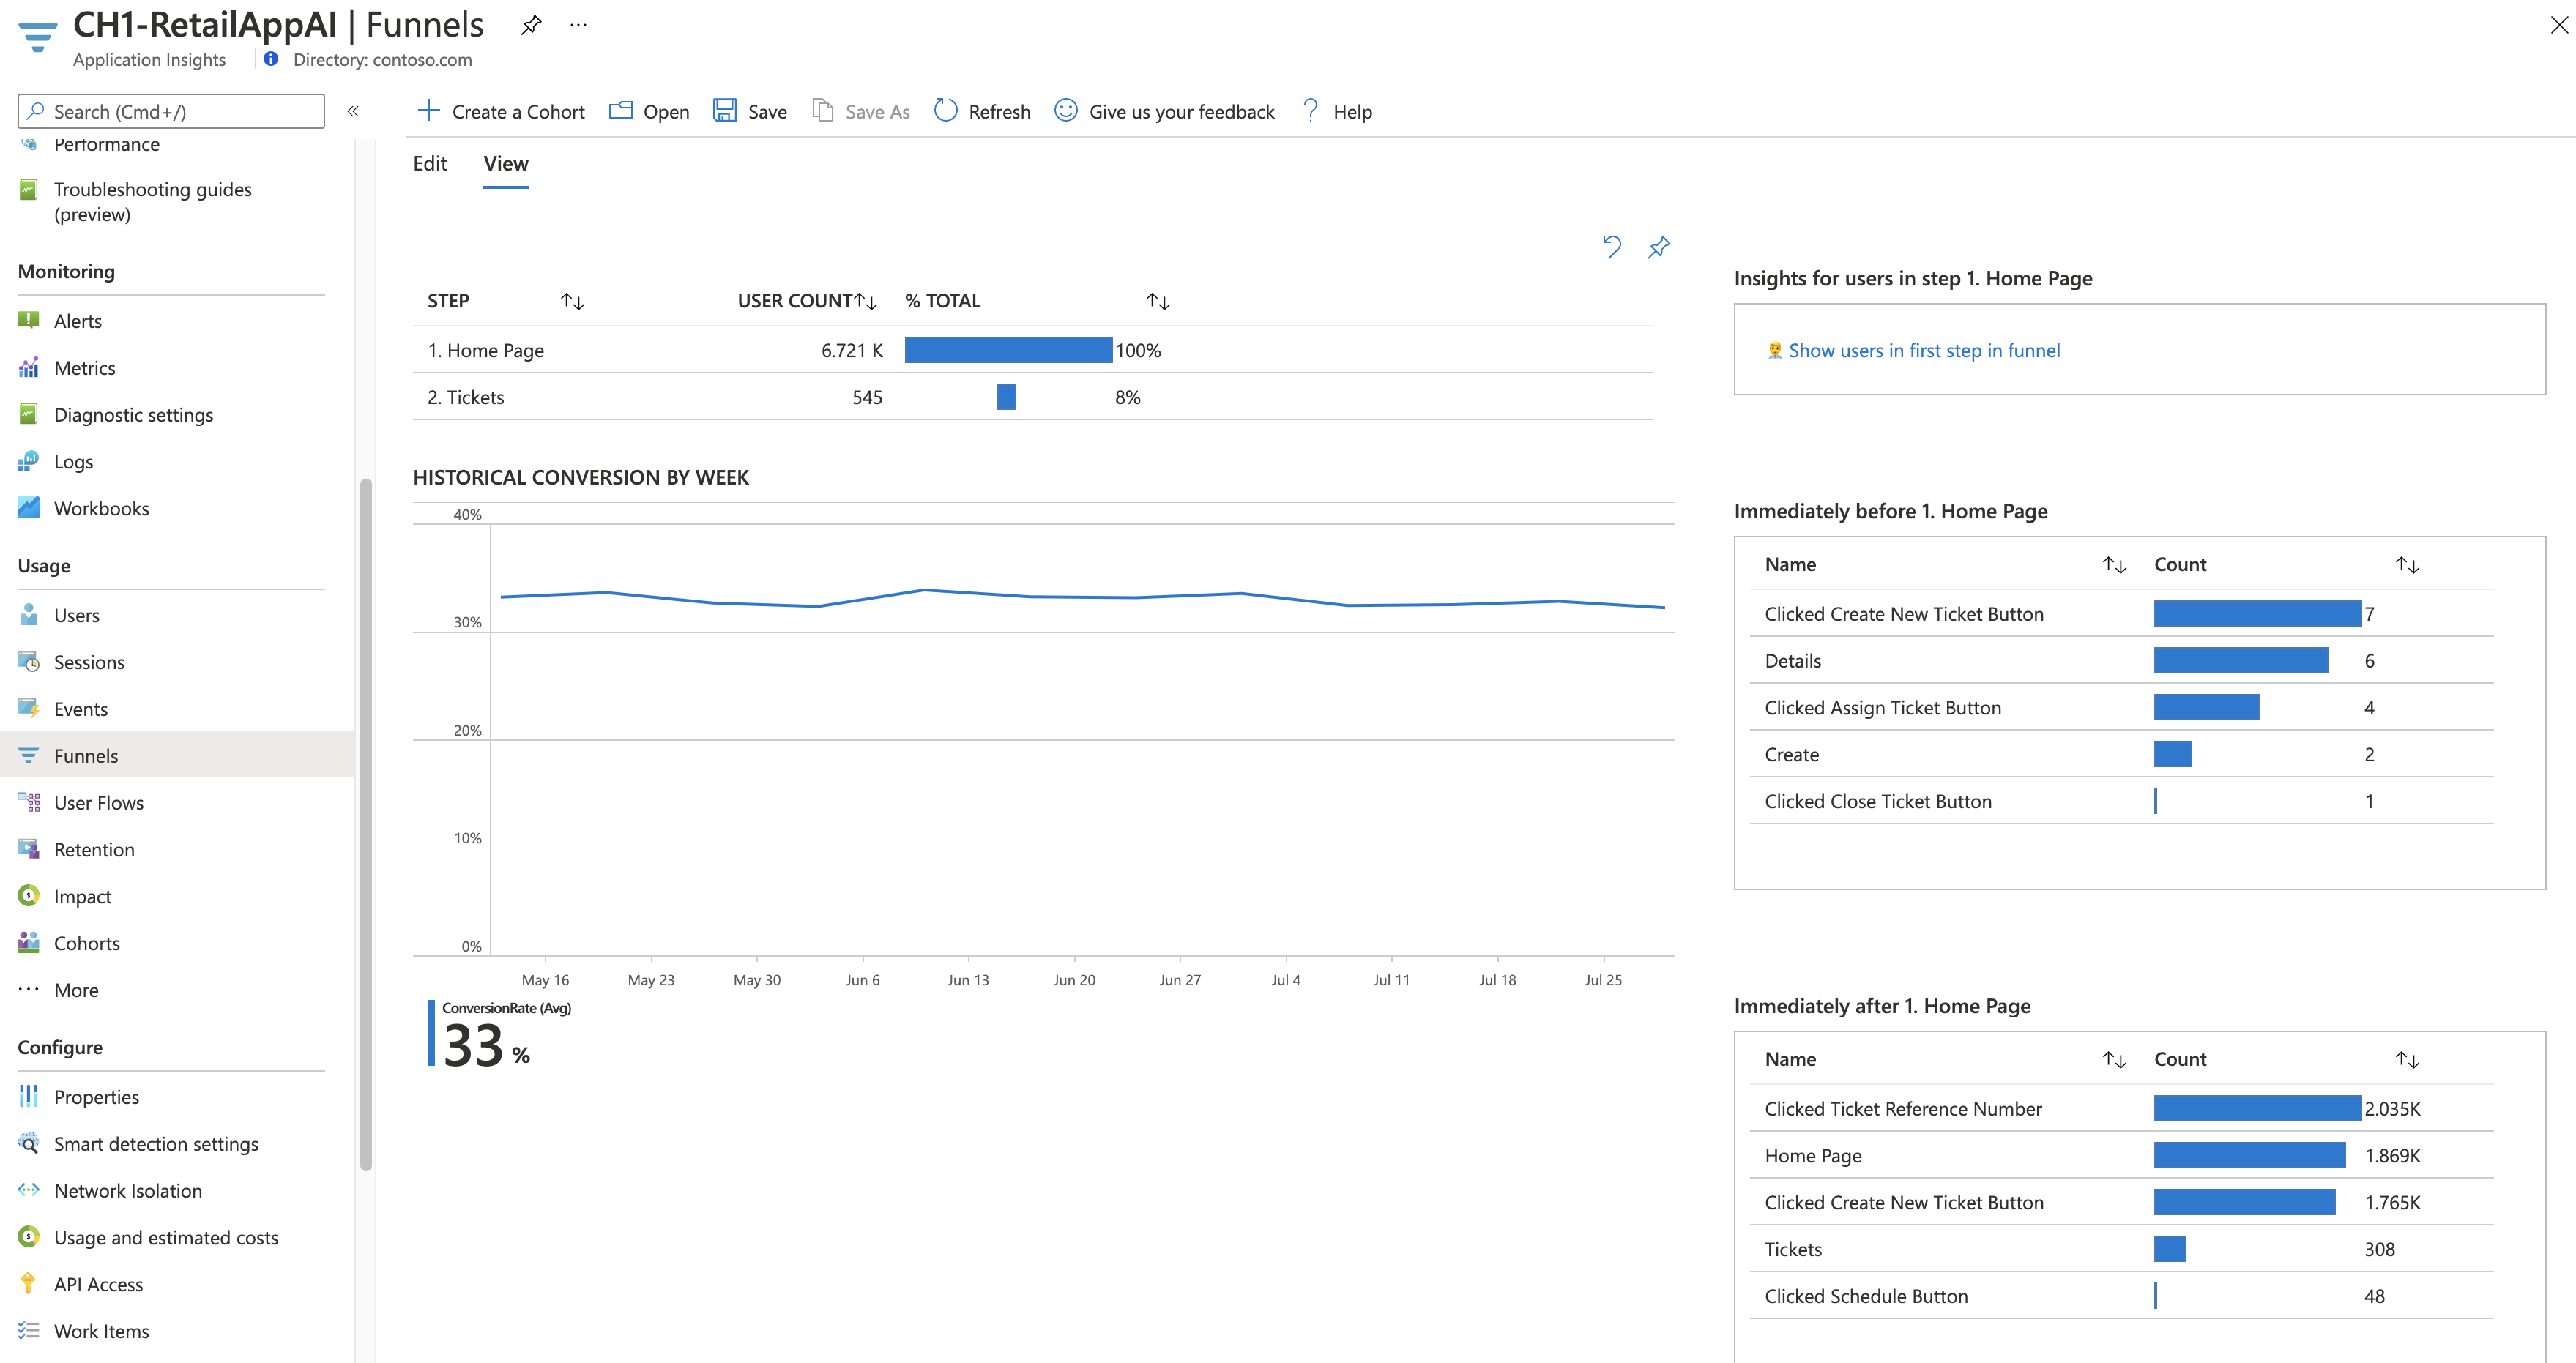
Monitoring Conversion Funnels
For applications with specific conversion goals, monitoring conversion funnels is essential. Azure Application Insights allows you to visualize user journeys and identify drop-off points in your conversion process. This insight enables you to optimize your application for higher conversion rates.
Optimizing for Mobile
With the prevalence of mobile apps, optimizing for mobile performance is crucial. Azure Application Insights provides mobile-specific metrics and visualizations, helping you ensure a seamless experience for your mobile users.
Collaboration through Shared Visualizations
Collaboration is key in any development process. Azure Application Insights enables you to share your visualizations and dashboards with team members, fostering collaborative decision-making based on the same data.
Staying Updated with Alerts
Proactive monitoring is essential to maintain application health. Azure Application Insights allows you to set up alerts based on specific thresholds. Visualizing these alerts ensures that your team is promptly notified of any anomalies requiring attention.
Integrating with Other Azure Services
Azure Application Insights seamlessly integrates with other Azure services, creating a comprehensive ecosystem for application monitoring. Visualizing data from various sources in one place enhances the holistic understanding of your application's performance.
Conclusion
Azure Application Insights empowers developers and teams with powerful tools to monitor, diagnose, and optimize application performance. Through effective data visualization, you can unlock the insights hidden within your data, leading to better-informed decisions and enhanced user experiences.
By Vishwas Acharya 😉
Checkout my other content as well:
YouTube:
Podcast: